Live on Google Play · Version 1.4.0

DEVICELAB
AUDIOPHILE

Your phone, rebuilt as an audio measurement bench.

27 tools on a hardware-style control panel: analyzers, meters, generators and alignment wizards, with IEC 61672-1 weighting, IEC 61260 octave bands and ISO 3382 room acoustics. Free, no account, and your audio never leaves the phone.

27
Tools
16384
FFT points
30-120
dB SPL range
1.4.0
Version
Signal
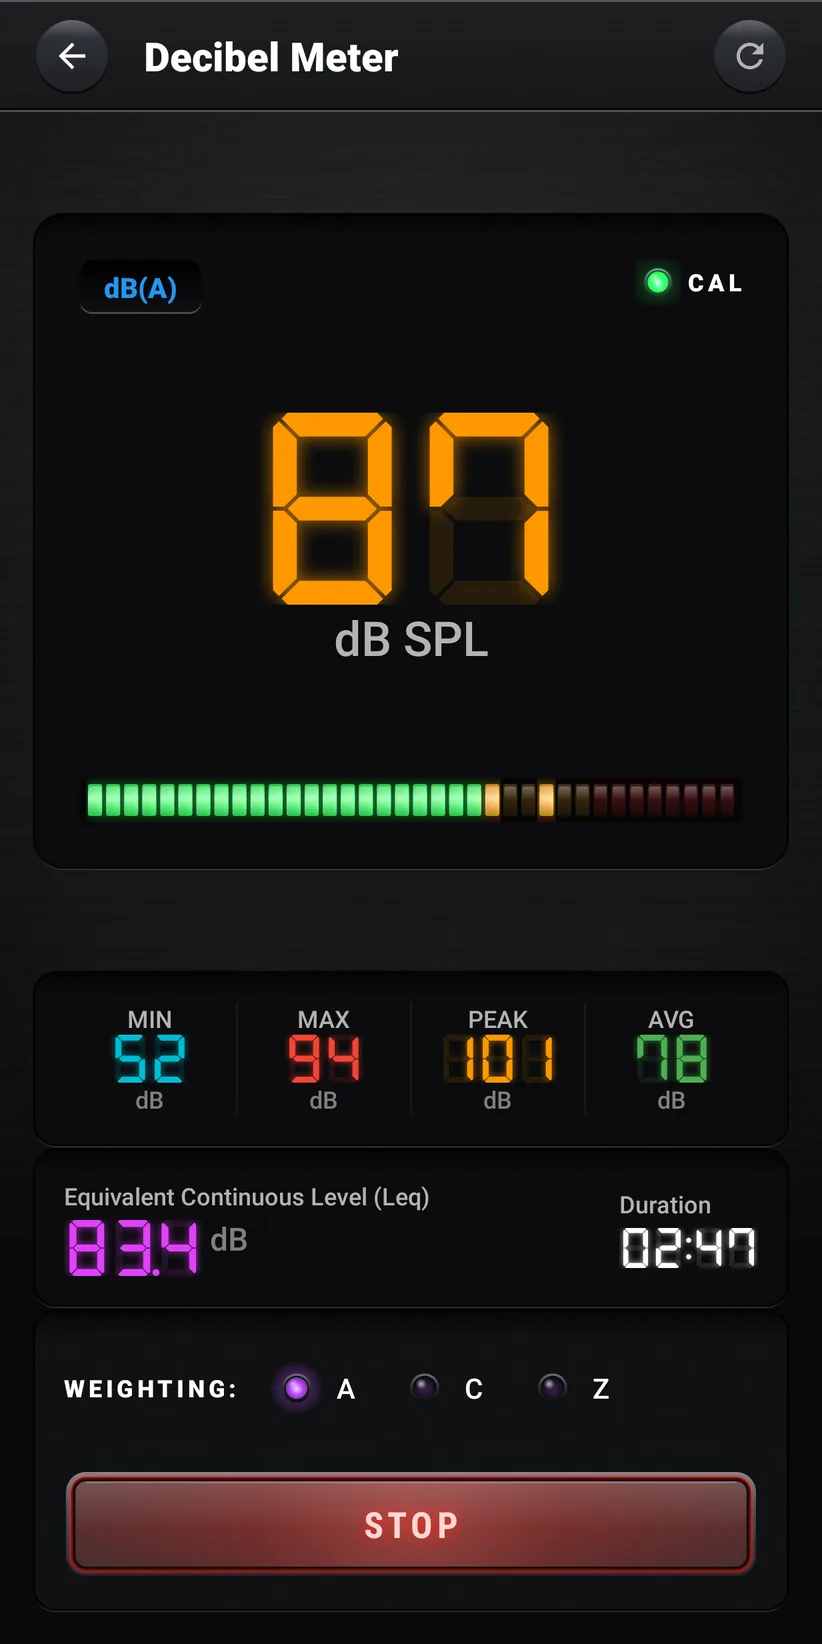
DL Audiophile Decibel Meter: 87 dB SPL on a seven-segment readout, LED ladder meter and A, C, Z weighting LEDs
Exploded view

Built like hardware. Layer by layer.

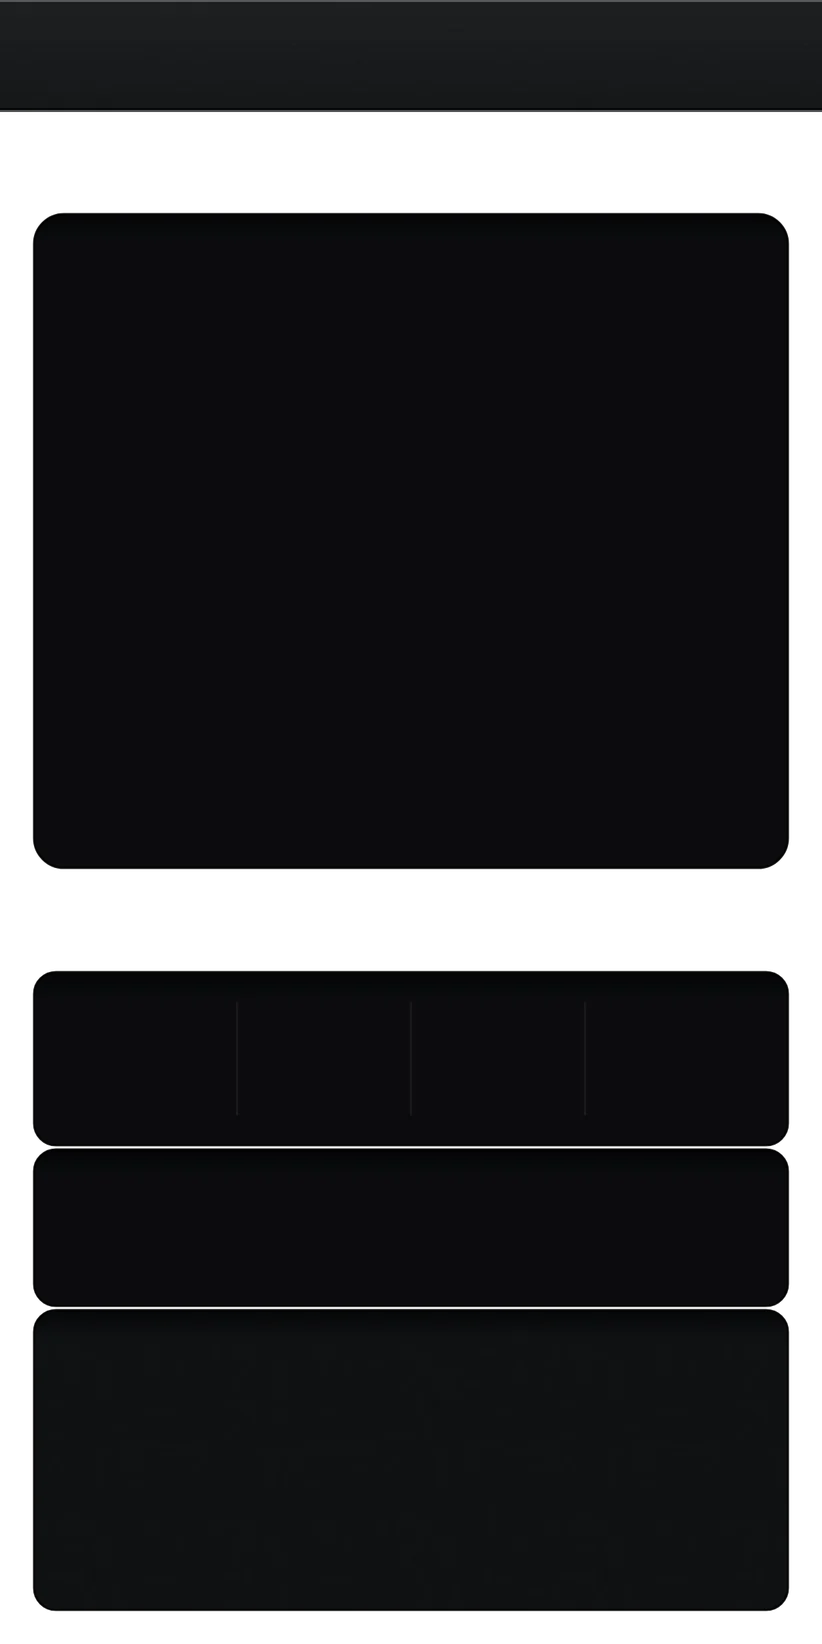
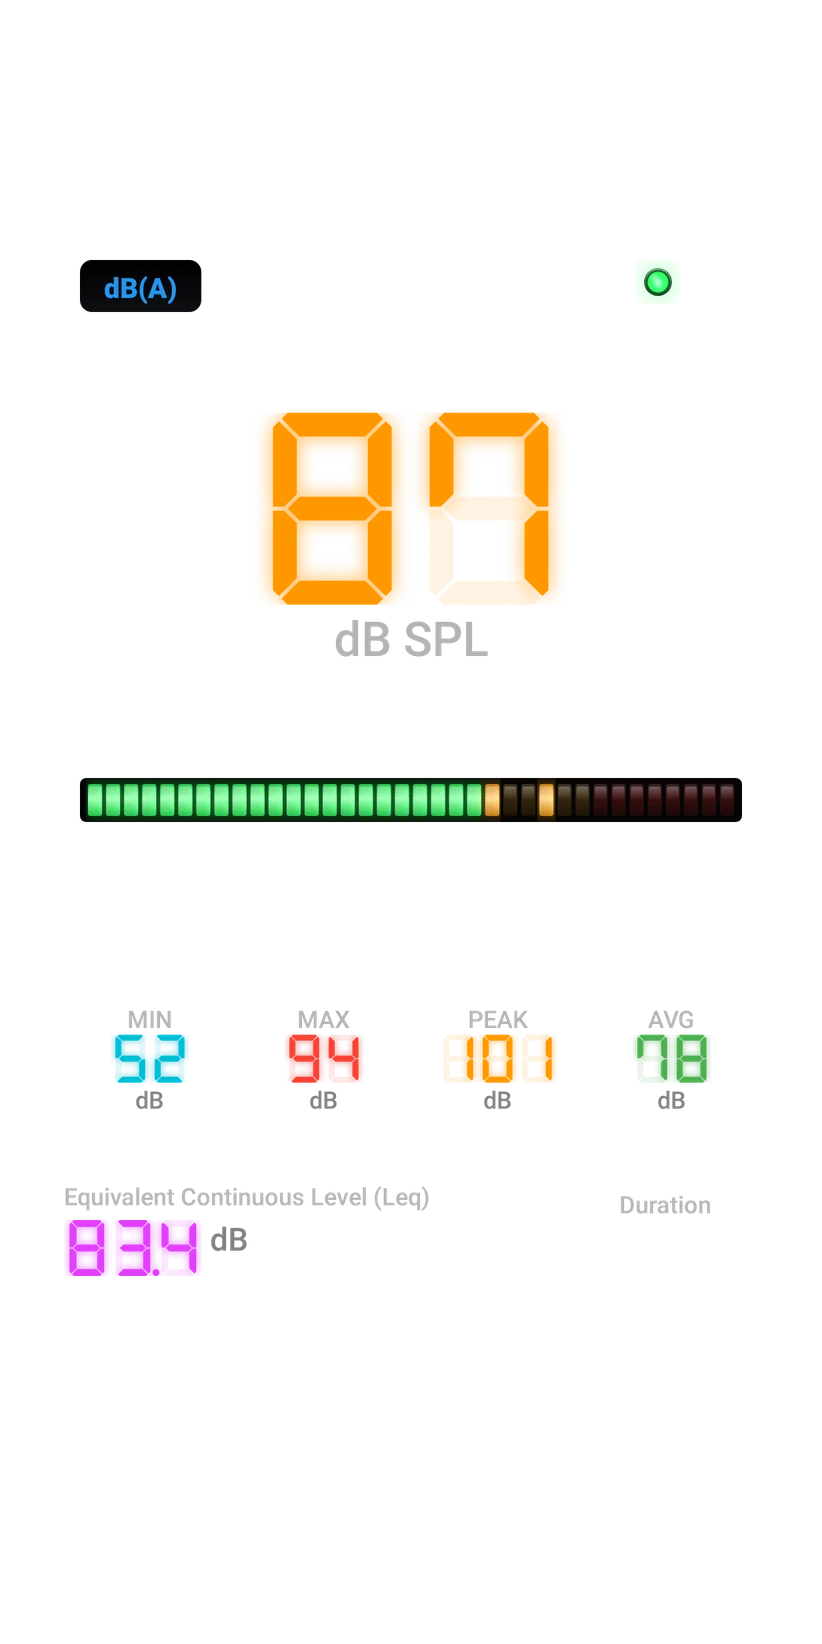
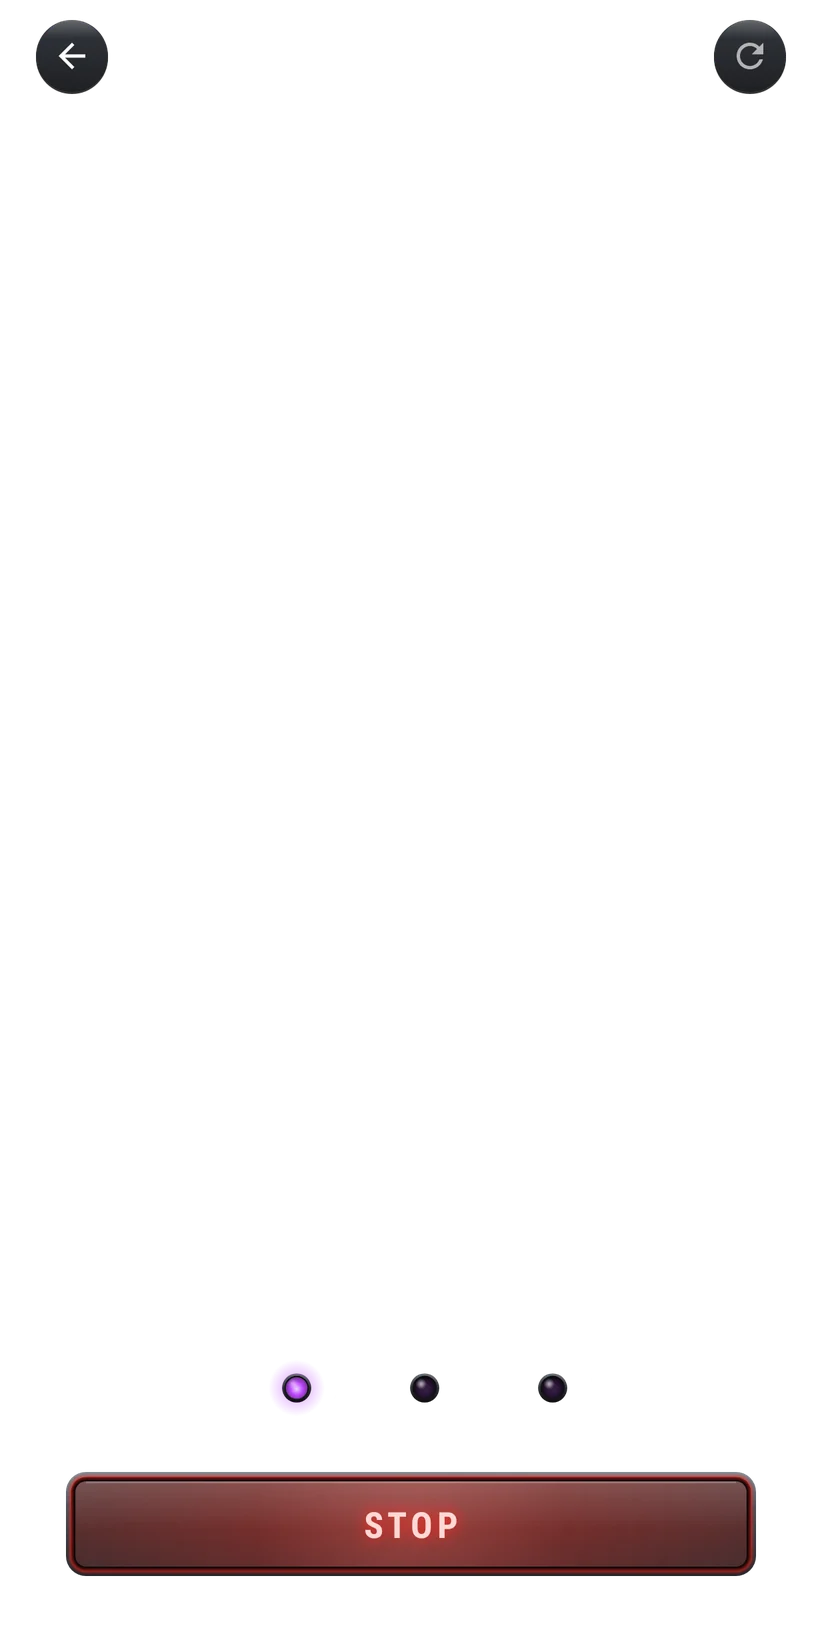
Every screen in version 1.4.0 is a control panel. These are the real layers of the app's interface, rendered from the app and pulled apart.

Decibel Meter screen, separated into its interface layers

Rendered from DL Audiophile 1.4.0; displays show demonstration signals.

The instrument rack

27 instruments. Two racks.

The dashboard is split the way a bench is: tools that listen through the microphone, and tools that play signals, test devices and keep your results. All of them are free.

Audio analysis

12
  • Audio OscilloscopeLive waveform, 100 µs–200 ms/div, Auto, Normal and Single trigger.
  • Spectrum AnalyzerFFT from 512 to 16,384 points, 20 Hz–20 kHz, A-weighting, peak hold.
  • SpectrogramScrolling frequency-over-time view, five palettes, 5–60 s window.
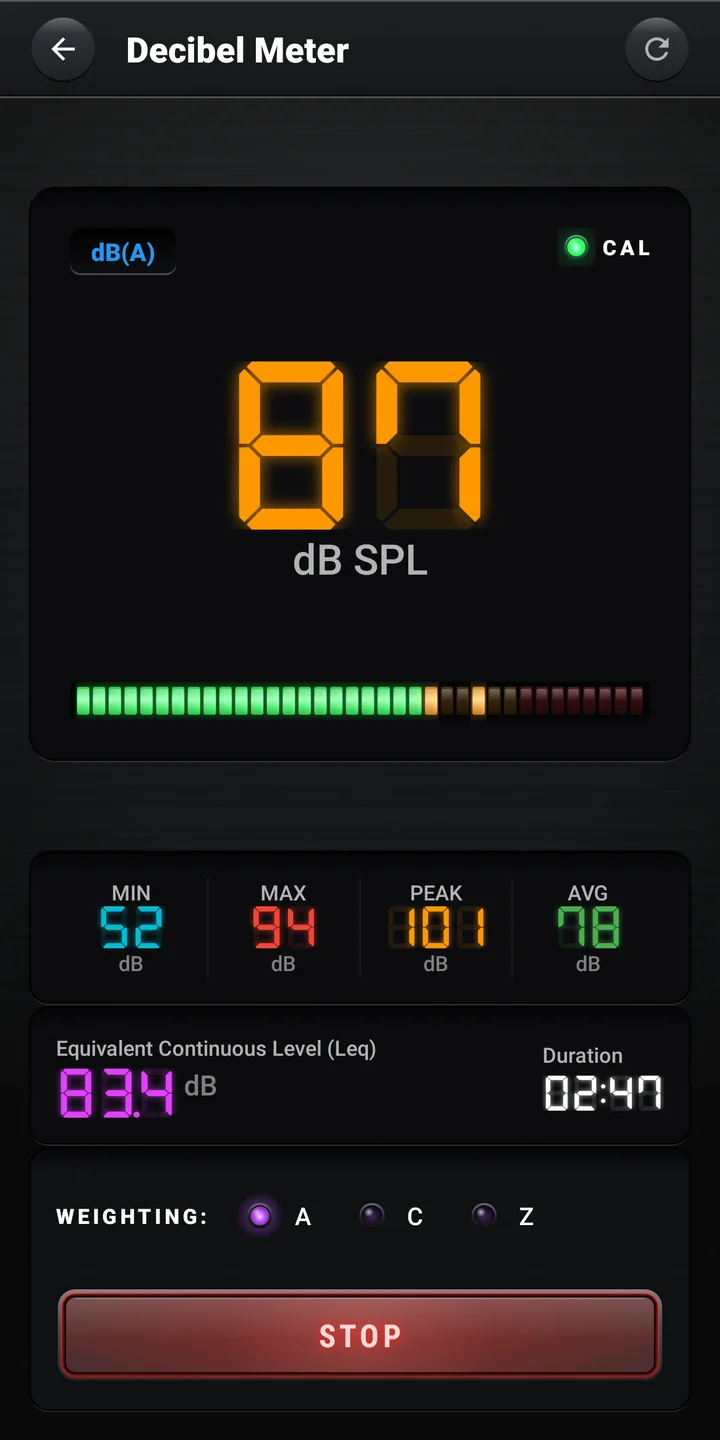
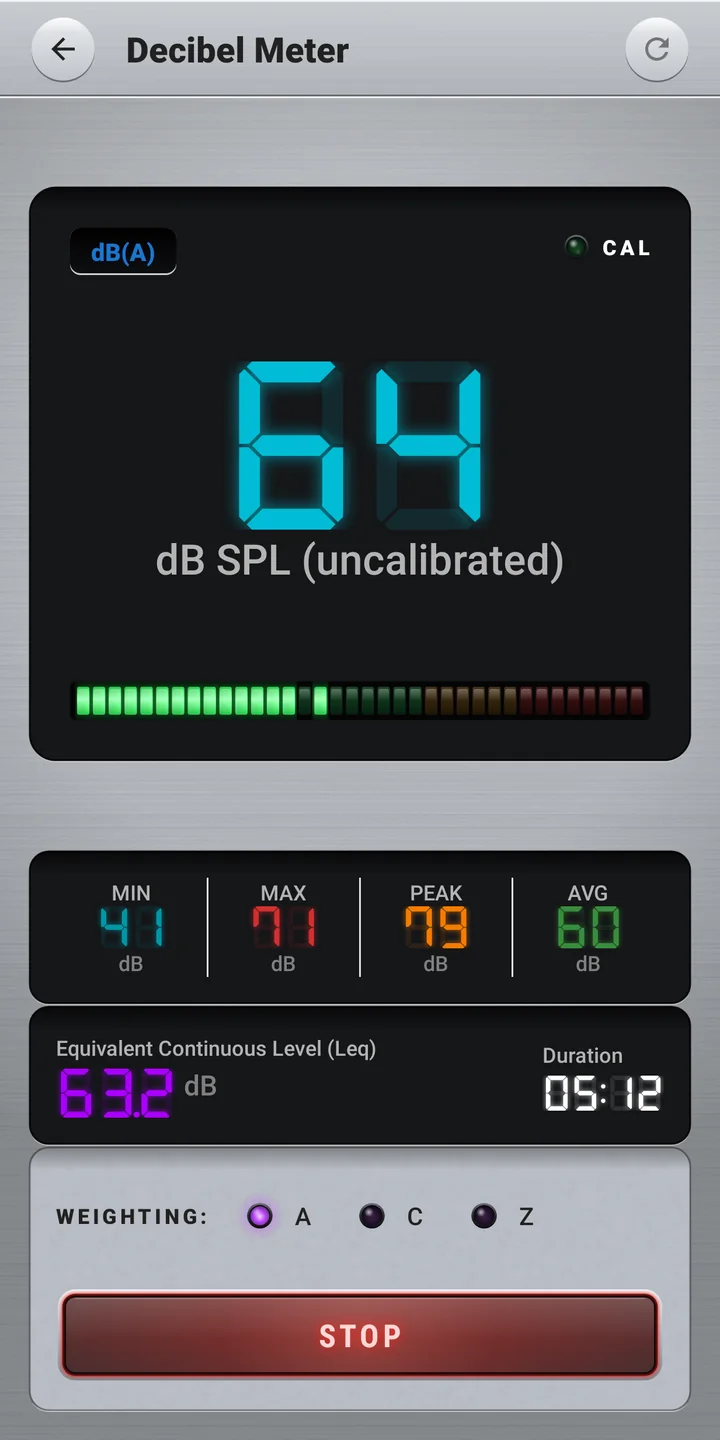
  • Decibel Meter (SPL)30–120 dB, IEC 61672-1 A/C/Z weighting, MIN, MAX, PEAK, AVG, Leq.
  • Room AcousticsRT60, EDT, C50 and C80 from a single clap or balloon pop.
  • Impedance AnalyzerAcoustic estimate of an impedance curve, Fs, Re, Zmax and Q.
  • Phase & Polarity TesterClick test for speaker polarity, correlation and coherence.
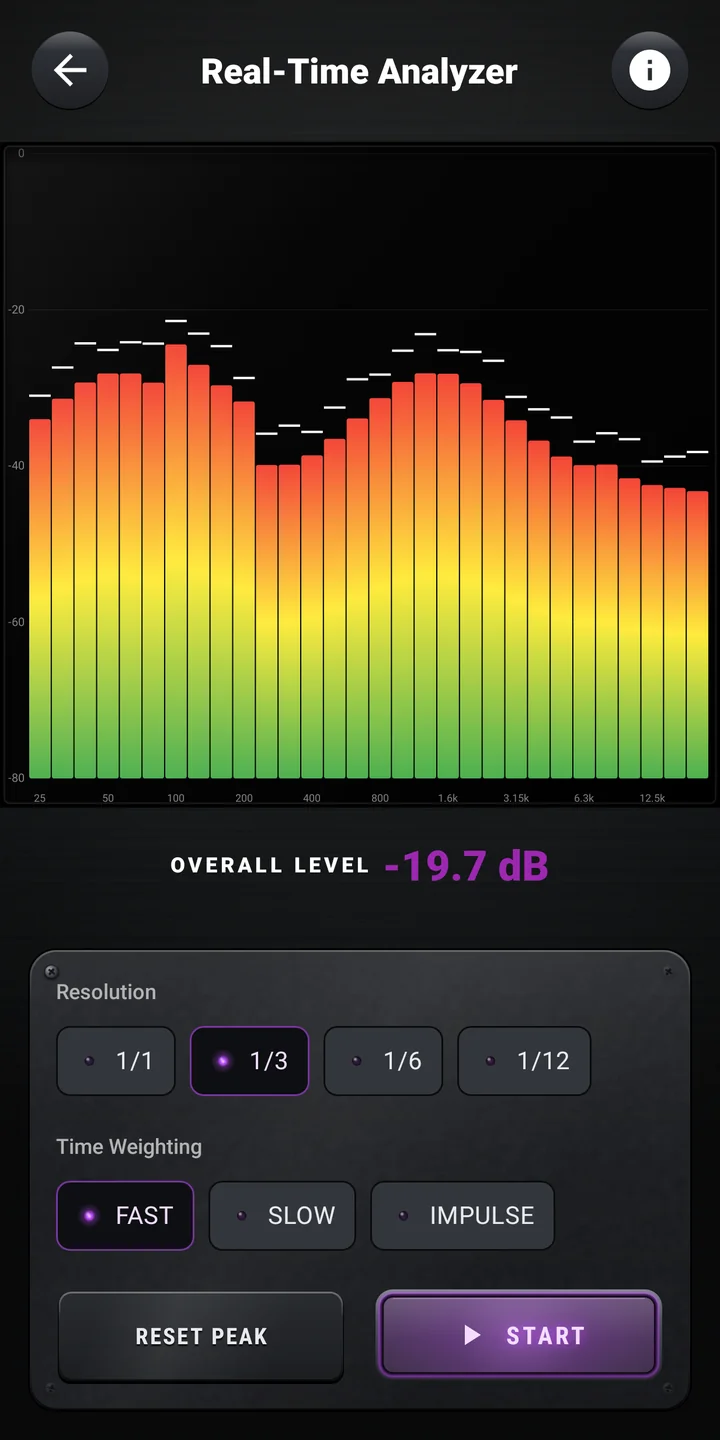
  • Real-Time Analyzer (RTA)IEC 61260 bands at 1/1 to 1/12 octave, Fast, Slow, Impulse.
  • Waterfall / CSDLive 3D waterfall that shows which frequencies keep ringing.
  • Impulse ResponseSchroeder decay curve, RT60, EDT, C50, C80 and center time.
  • THD MeasurementTHD (H2–H11), THD+N, SINAD and ENOB on a 16,384-point FFT.
  • SNR MeasurementSignal-to-noise, noise floor, dynamic range, crest and headroom.

Output testing

15
  • Frequency Generator20 Hz–20 kHz log knob, four waveforms, noise, repeating sweeps.
  • Noise GeneratorWhite, pink, brown, blue and violet noise with fades.
  • Frequency ResponseLog, linear or stepped sweep, plotted from the microphone.
  • Speaker TestL/R identification, four test tones, sweep and polarity pulses.
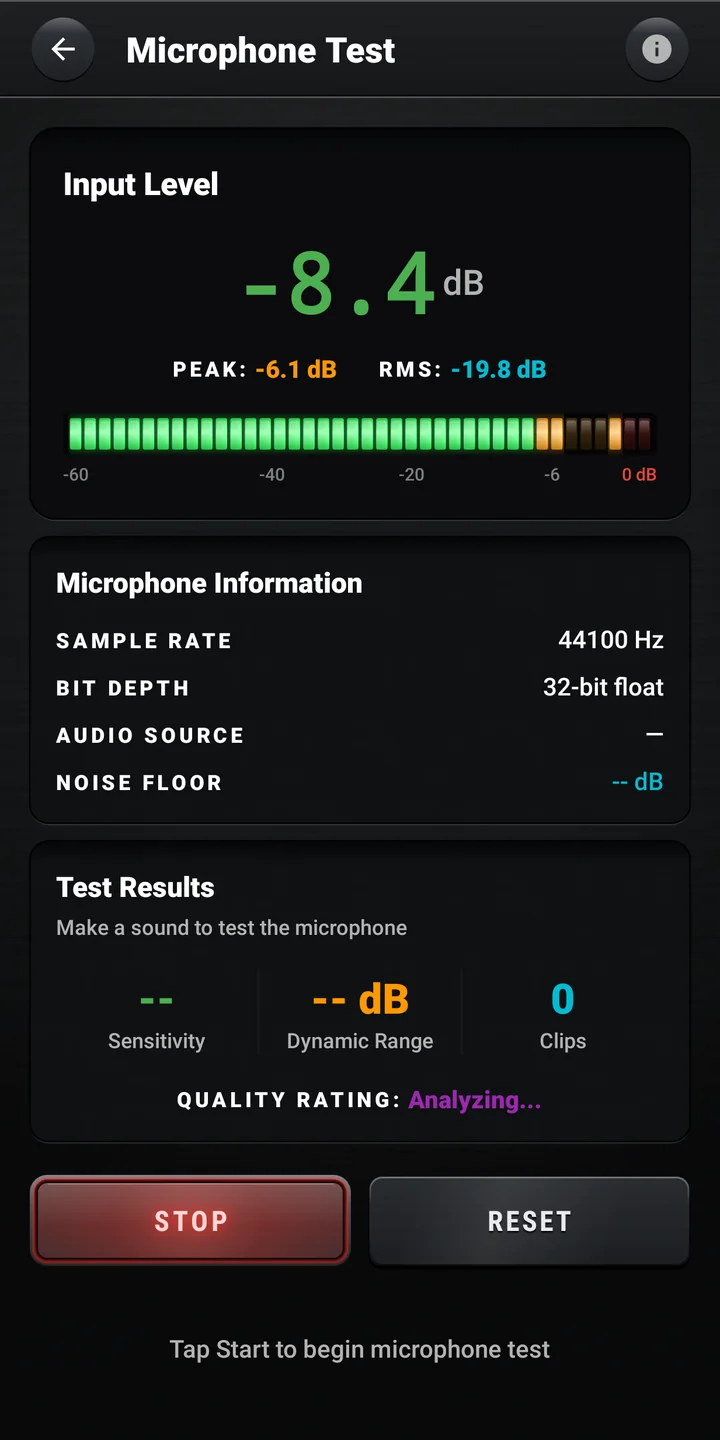
  • Microphone TestInput level, clipping, noise floor, dynamic range and rating.
  • Audio Latency TestRound-trip latency with min, average, max and jitter.
  • Bluetooth LatencyDevice, codec and measured Bluetooth delay with confidence.
  • BT Alignment WizardFive guided steps to time-align Bluetooth with a wired source.
  • USB Audio TestingOutput, input and latency tests for USB DACs and interfaces.
  • Multi-Channel TestChannel identification for 2.0, 2.1, 5.1 and 7.1 systems.
  • Channel BalanceLeft/right level difference on twin LED meters.
  • Speaker Alignment SuiteDelay, response matching and phase checks for multi-speaker setups.
  • Calibration ManagerSPL reference calibration plus microphone, voltage and line records.
  • Reports & ExportSaved results as CSV, PDF or text through the share sheet.
  • Audio Device InfoInputs, outputs, formats and Low Latency, Pro Audio, MIDI, USB lamps.
Instrument spotlight

Six instruments, up close.

Each module shows an example reading on the same seven-segment display the app uses, with the specification behind it.

Decibel Meter

87.0dB(A) SPL
Example reading
  • IEC 61672-1 A, C and Z weighting filters
  • MIN, MAX, PEAK, AVG and Leq, updated every 50 ms
  • 30–120 dB LED ladder with a 2-second peak hold
  • CAL lamp lights when your SPL calibration is applied
THD Measurement

0.012% THD
Example reading
  • Harmonics H2 to H11, plus THD+N, SINAD and ENOB
  • 16,384-point FFT with a 7-term Blackman-Harris window
  • Main-lobe summation: no dependence on bin alignment
  • Auto-detect, 1 kHz or 440 Hz fundamental

Real-Time Analyzer

-19.7dBFS overall
Example reading
  • IEC 61260 bands at 1/1, 1/3, 1/6 and 1/12 octave
  • Fast 125 ms, Slow 1 s and Impulse time weighting
  • Band power sums, so pink noise reads flat
  • 48 kHz capture, 8,192-point FFT, Hann window

Room Acoustics

0.58s RT60
Example reading
  • RT60 from the full decay, or T30 then T20 per ISO 3382
  • Early Decay Time, C50 speech and C80 music clarity
  • One clap or balloon pop, three seconds of capture
  • Rated Excellent, Good, Fair or Needs Improvement

Audio Oscilloscope

441Hz
Example reading
  • 11 time bases from 100 µs to 200 ms per division
  • Auto, Normal and Single trigger with level fader
  • Frequency and period from on-screen zero crossings
  • Vpp and Vrms in full-scale units

Speaker Alignment Suite

3.42ms delay
Example reading
  • Delay: five chirps per speaker, DSP offset per channel
  • Response matching with a 0–100% match score
  • Phase check with polarity and per-band grades
  • Save to library, share as text or PDF
Screens

The panel, screen by screen.

Real screens from version 1.4.0. Displays show demonstration signals.
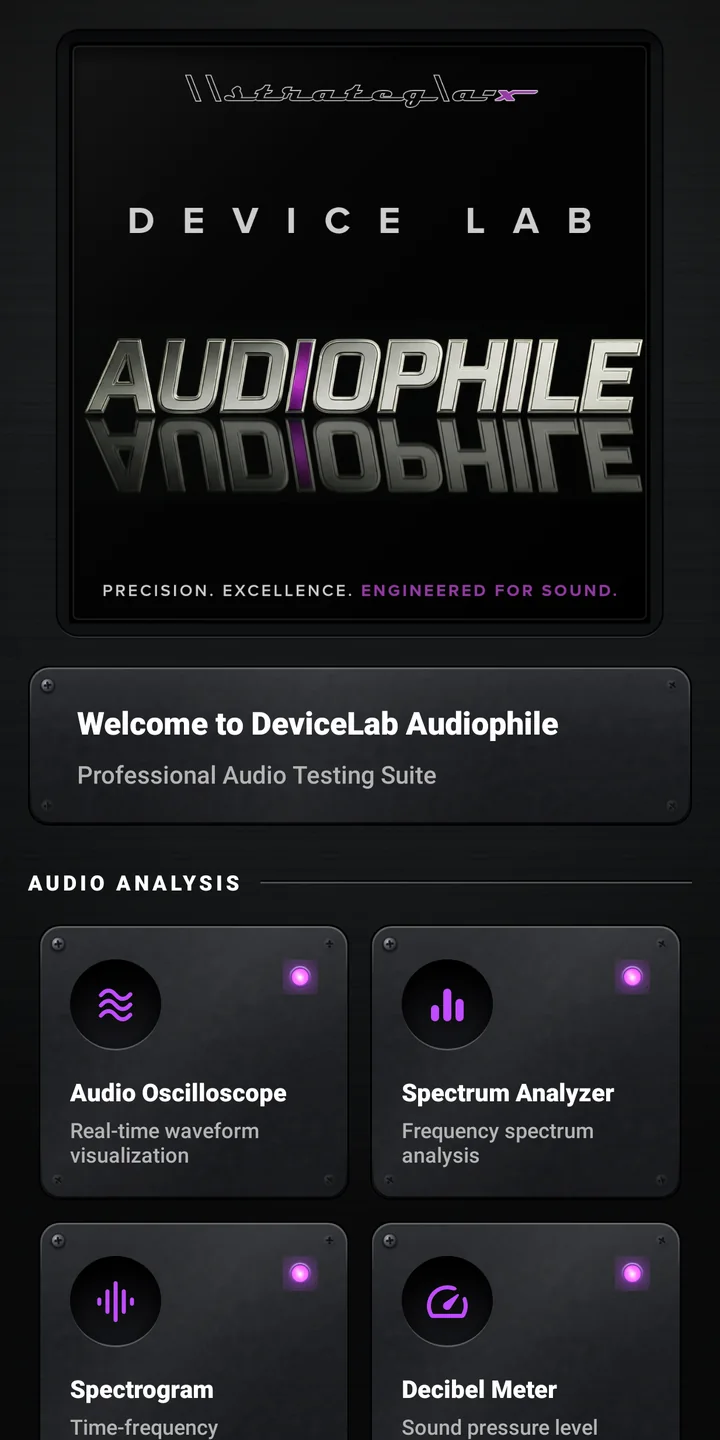
DL Audiophile Dashboard: 27 tools in two sections: Audio Analysis (12) and Output Testing (15).
Dashboard27 tools in two sections: Audio Analysis (12) and Output Testing (15).
DL Audiophile Decibel Meter: A/C/Z weighting, LED ladder with peak hold, CAL lamp when calibrated.
Decibel MeterA/C/Z weighting, LED ladder with peak hold, CAL lamp when calibrated.
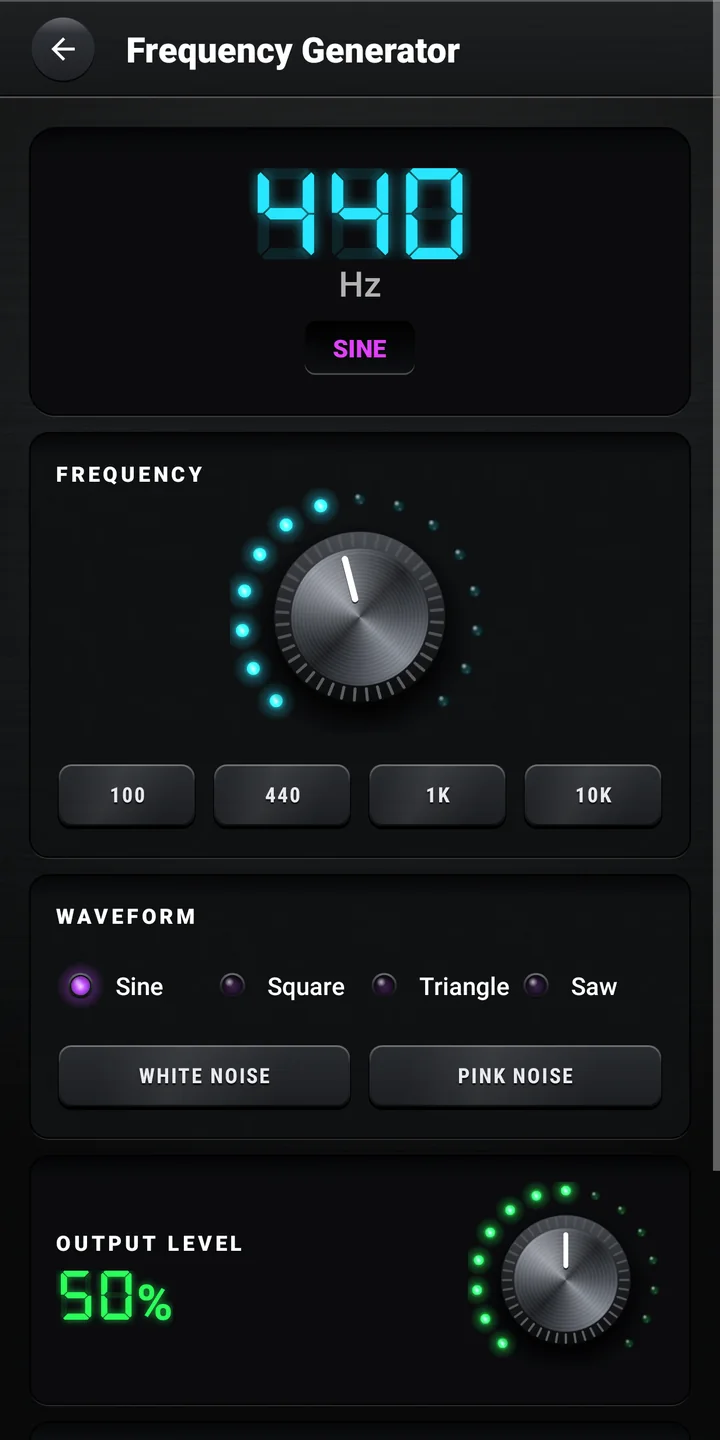
DL Audiophile Frequency Generator: Logarithmic frequency knob, presets, four waveforms, noise and sweeps.
Frequency GeneratorLogarithmic frequency knob, presets, four waveforms, noise and sweeps.
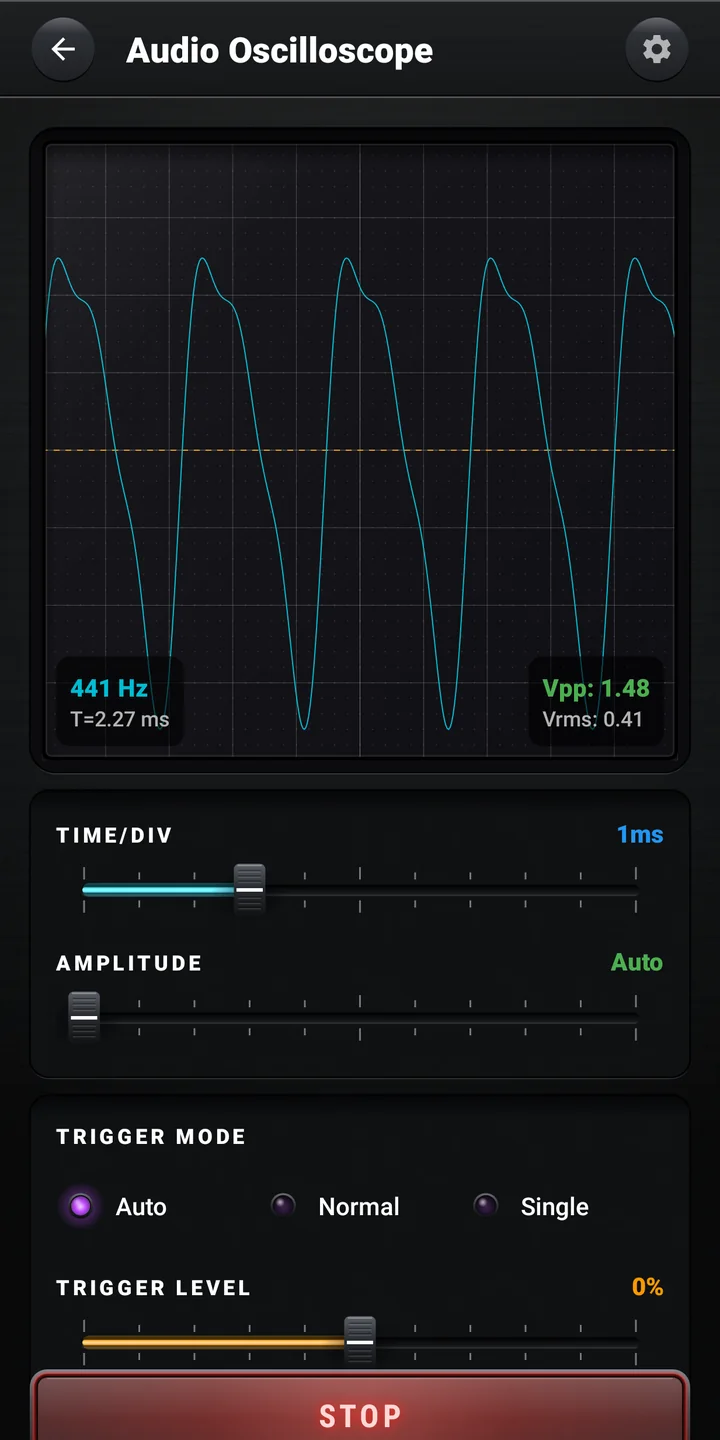
DL Audiophile Oscilloscope: Faders for time base and trigger level; Auto, Normal and Single trigger.
OscilloscopeFaders for time base and trigger level; Auto, Normal and Single trigger.
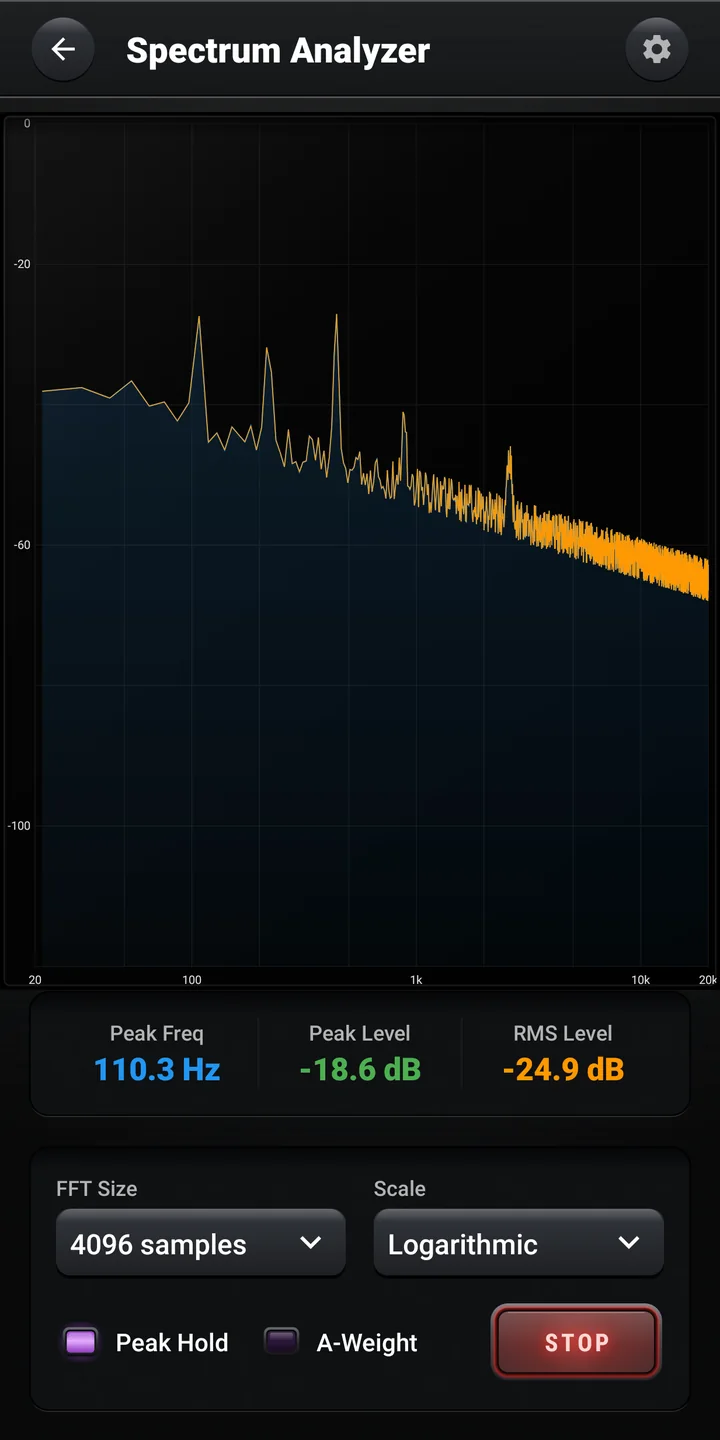
DL Audiophile Spectrum Analyzer: 20 Hz–20 kHz, 0 to −120 dBFS, up to 16,384-point FFT.
Spectrum Analyzer20 Hz–20 kHz, 0 to −120 dBFS, up to 16,384-point FFT.
DL Audiophile Real-Time Analyzer: Fractional-octave bars with falling peak markers.
Real-Time AnalyzerFractional-octave bars with falling peak markers.
DL Audiophile Microphone Test: −60 to 0 dBFS LED meter, clipping count and noise floor.
Microphone Test−60 to 0 dBFS LED meter, clipping count and noise floor.
DL Audiophile Brushed Silver: The same Decibel Meter in the light, brushed-silver finish.
Brushed SilverThe same Decibel Meter in the light, brushed-silver finish.
Two finishes

Black anodised or brushed silver.

One switch in Settings (Dark Finish) re-skins every panel. Both finishes use the same procedurally generated aluminium textures; displays stay dark in either so readouts keep their contrast.

Decibel Meter in the black anodised finish
Decibel Meter in the brushed silver finish
Engineering

Measured to the standard. Honest about the limits.

Version 1.4.0 rebuilt the analysis engine around published methods, and every level is reported in absolute dBFS so tools agree with each other.

IEC 61672-1

Frequency weighting

A, C and Z filters on the SPL meter and the analyzers, normalised so all three read the same at 1 kHz.

IEC 61260

Fractional-octave bands

RTA bands at 1/1, 1/3, 1/6 and 1/12 octave on the standard nominal frequencies.

ISO 3382

Room acoustics

Schroeder backward integration; RT60 from the full decay, or extrapolated from T30, then T20.

dBFS

Digital full scale

Analysis levels are absolute dBFS: a full-scale sine reads 0 dB, so readings compare across tools.

Specifications
Version
1.4.0
Android
7.0+ (API 24), targets API 36
Built with
Kotlin · Android Views
Interface
Custom hardware widget kit
Capture
44.1 kHz / 48 kHz per tool
FFT
512 to 16,384 points
Storage
Room database, on-device
Exports
CSV · PDF · plain text
Finishes
Black anodised · Brushed silver
Price
Free, ad-supported

Know your instrument

  • Phone microphones are tuned for voice: expect less accuracy in the deep bass and at very high levels. A USB measurement microphone does better.
  • SPL readings are estimates until you run an SPL Reference Calibration with a 1 kHz acoustic calibrator.
  • The Impedance Analyzer is an acoustic estimate. It can't measure voltage and current at a driver's terminals, so use a jig for enclosure design.
  • Speaker Alignment plays every test signal through the phone's output; arrange your system so only the speaker being measured plays.
  • DL Audiophile is a measurement aid, not a certified instrument. Verify critical work with calibrated equipment.
Data safety

Your audio never leaves the phone.

Measurements happen on the device. Nothing is recorded, nothing is uploaded, and there is no account to create.

Privacy policy

Processed on the phone

Audio is analyzed on the device in real time. It is never uploaded.

Never recorded

Microphone audio is never saved as a recording. Saved results are numbers and text.

No account

No sign-up, email or phone number. Every tool works from the first launch.

Minimal permissions

Microphone for measurements. Nearby devices (Android 12+) only to read a connected headset's name and codec; the app never scans or pairs. No storage, location, contacts or camera.

Your data stays local

Measurements, calibrations and settings live in the app's private storage. Exports go only where you send them.

Consent-first ads

Free with Google AdMob ads. Where consent is required (such as the EEA and UK), ads load only after you choose, and you can change it in Settings.

Built for

Anyone who takes sound seriously.

Audio engineers

THD, SNR, RTA and spectrum checks of a signal chain, with CSV and PDF reports for documentation.

Speaker builders

Polarity checks, frequency sweeps, waterfall views of ringing, and impedance estimates to compare drivers.

Home theater

Speaker Alignment Suite, multi-channel identification, channel balance and the Bluetooth alignment wizard.

Musicians & studios

RT60 and clarity of a rehearsal or recording room, SPL monitoring and live spectrum views.

QA & field techs

Microphone health, USB audio, round-trip latency and what audio hardware a phone reports.

Studio manual

User guide

How to use all 27 tools and read their results, for version 1.4.0. The same guide is built into the app (dashboard → User Guide).

Getting Started3 topics
First run and the dashboard

A splash screen, a five-page introduction, Google's consent form where it is required, then the dashboard with a one-time tour.

How to use it

  1. 1Install DL Audiophile from Google Play (Android 7.0 or later) and open it.
  2. 2The splash screen loads your settings and any stored SPL calibration, and tells you whether SPL readings are calibrated.
  3. 3Five onboarding pages follow: Welcome, Audio Analysis Suite, Device Testing, Calibrate for Accuracy and Data Export. Tap NEXT, Skip, or GET STARTED on the last page.
  4. 4In regions that require it, such as the EEA and UK, Google's consent form asks how ads may use your data.
  5. 5The dashboard has two sections: AUDIO ANALYSIS (12 tools that listen through the microphone) and OUTPUT TESTING (15 tools that play signals, test devices and manage results). The bottom buttons open User Guide, Tutorial and Settings.
  6. 6Allow microphone access the first time you start a measurement. On Android 12 and later, the Bluetooth tools also ask for Nearby devices.

Tips

  • Every measurement works offline; the internet is only used for ads and the consent form.
  • Replay the dashboard tour at any time with the Tutorial button.
  • Calibrate the SPL meter before you quote absolute levels.
Using the panel

Every screen is built like studio hardware, and the controls behave like their real counterparts.

How to use it

  1. 1Pads are back-lit rubber buttons for the main action: START and PLAY are green and turn into a red STOP while running.
  2. 2Keys are metal push buttons for presets and options, such as frequency presets, palettes, Reset and Clear.
  3. 3LEDs show the selected option in a group, progress through wizard steps, and status lamps such as CAL on the SPL meter.
  4. 4Faders slide like a mixing desk: time base, trigger level, sensitivity and volume.
  5. 5Knobs turn when you drag around them, or up and down near the center. Each step gives a detent tick and the LED ring shows the position.
  6. 6Seven-segment readouts show the main values; dashes mean there is no reading yet. LED ladder meters run green, then amber, then red, with one LED holding the recent peak.

Tips

  • Most tools stop measuring or playing when you leave their screen.
  • Switch between black anodised and brushed silver panels with Settings → Dark Finish.
Settings

Starting values for the tools, the panel finish, haptics and your default export format.

How to use it

  1. 1FFT Size: the Spectrum Analyzer's starting resolution, 512 to 16,384 points (default 4,096).
  2. 2Dark Finish: on gives black anodised panels, off gives brushed silver. It applies straight away.
  3. 3Auto Scale: the Oscilloscope opens with automatic amplitude (default on).
  4. 4Show Peak Hold: the Spectrum Analyzer opens with Peak Hold on (default on).
  5. 5Haptic Feedback: vibration for button presses and knob detents (default on).
  6. 6Export Format: CSV, PDF or Both (default CSV).
  7. 7Privacy Settings reopens Google's consent form where it is required; Privacy Policy and Terms open on strategia-x.com.

Tips

  • The gear key on the Oscilloscope and Spectrogram opens Settings.
  • Each tool runs at a fixed 44.1 kHz or 48 kHz; there is no sample-rate setting.
Audio Analysis12 topics
Audio Oscilloscope

The microphone signal as a live waveform, like a bench oscilloscope.

How to use it

  1. 1Press START.
  2. 2Time/Div fader: 100 µs to 200 ms per division (default 5 ms), with 10 divisions across the screen.
  3. 3Amplitude: Auto (default) or a fixed gain from 10% to 10,000%. At 100%, a full-scale signal fills the screen.
  4. 4Trigger Mode LEDs: Auto always draws and locks to a rising edge when it finds one; Normal redraws only when the signal crosses the trigger level; Single freezes on the first trigger.
  5. 5Trigger Level fader: −100% to +100% of full scale.
  6. 6Read frequency and period (counted from the zero crossings on screen), and Vpp and Vrms in full-scale units, where 1.000 is digital full scale.

Tips

  • Set the time base so two to five cycles fit on screen.
  • Use Normal or Single to freeze transients. To re-arm Single, pick another mode and then Single again.
  • Vpp and Vrms are full-scale units, not volts.
Spectrum Analyzer

A live FFT spectrum from 20 Hz to 20 kHz, 0 to −120 dBFS.

How to use it

  1. 1Press START.
  2. 2FFT Size: 512, 1,024, 2,048, 4,096, 8,192 or 16,384 samples. It starts at the size chosen in Settings.
  3. 3Scale switches the frequency axis between Logarithmic and Linear.
  4. 4Peak Hold keeps the highest level at each frequency; untick it to clear.
  5. 5A-Weight applies the IEC 61672 A-weighting curve.
  6. 6Read Peak Freq (the strongest component above 20 Hz), Peak Level and RMS Level in dBFS.

Tips

  • Resolution is 44,100 ÷ FFT size: about 86 Hz at 512, 10.8 Hz at 4,096 and 2.7 Hz at 16,384.
  • Larger sizes separate close tones but update less often.
  • Use Peak Hold to catch short or intermittent sounds.
Spectrogram

Frequency over time. Frequency runs up the screen (20 Hz to 20 kHz), time scrolls from right to left, and color shows level.

How to use it

  1. 1Press START.
  2. 2Color Palette: Heat (default), Rainbow, Plasma, Viridis or Gray.
  3. 3Frequency Scale: Log (default) or Linear.
  4. 4Time Window: 5, 10, 20, 30 or 60 seconds.
  5. 5Sensitivity sets the bottom of the color scale: −60, −80, −90 (default), −100 or −120 dB. The top is 0 dBFS.
  6. 6Read Peak (the strongest frequency) and Level.

Tips

  • Horizontal lines are steady tones such as hum, whine or resonances; vertical streaks are clicks and transients.
  • A lower Sensitivity floor reveals quieter sounds; a higher one adds contrast to loud events.
  • The spectrogram uses a 2,048-point FFT, about 21.5 Hz per bin.
Decibel Meter (SPL)

Sound pressure level from 30 to 120 dB with IEC 61672-1 A, C and Z weighting.

How to use it

  1. 1Press START and point the microphone at the sound.
  2. 2Choose the weighting with the A, C and Z LEDs.
  3. 3The seven-segment readout updates every 50 ms: cyan below 70 dB, green 70–84, orange 85–99, red 100 and above.
  4. 4The LED ladder spans 30–120 dB; its peak LED holds for 2 seconds, then falls.
  5. 5MIN and MAX are the lowest and highest 50 ms RMS readings, PEAK is the highest instantaneous sample level, AVG averages the dB readings and Leq is the energy average.
  6. 6The reset key at the top right clears the statistics.

Tips

  • With an SPL calibration stored, the CAL lamp lights and the unit reads dB SPL. Without one, it reads dB SPL (uncalibrated) and uses a typical 94 dB offset.
  • A suits environmental and workplace noise, C suits loud or bass-heavy sound, and Z is unweighted.
  • Readings are plain 50 ms levels; there is no Fast/Slow time weighting.
Room Acoustics

How long sound lingers in a room, measured from one loud impulse.

How to use it

  1. 1Stand at the listening position in a quiet room, with fans and air conditioning off.
  2. 2Tap Start Measurement and wait for the 3-2-1 countdown.
  3. 3When CLAP NOW! appears, clap sharply once or pop a balloon. The app records 3 seconds.
  4. 4Read RT60, measured over the full decay when the recording allows, otherwise estimated from T30 and then T20 as ISO 3382 describes.
  5. 5EDT comes from the first 10 dB of decay; C50 (speech) and C80 (music) compare early and late energy in dB.
  6. 6Results are saved to Reports automatically; Export Results shares a text report.

Tips

  • RT60 under 0.3 s is very dry, 0.3–0.5 s dry, 0.5–0.8 s ideal for speech, 0.8–1.2 s ideal for music, 1.2–2 s reverberant and over 2 s very reverberant.
  • A balloon pop is sharper and louder than a clap and gives a better decay.
  • Measure at a few seats, not only the exact center of the room.
Impedance Analyzer

A rough acoustic estimate of a driver's impedance curve and Thiele-Small figures.

How to use it

  1. 1Tap Start Analysis.
  2. 2The app plays a 2-second broadband test signal (48 log-spaced tones from 10 Hz to 20 kHz) through the phone's output while recording the microphone.
  3. 3It compares the recording with the signal against a 10 Ω reference and draws the impedance magnitude curve.
  4. 4Read Fs (the frequency of the curve's peak), Zmax (its height), Re (the average below 100 Hz) and Qts, Qes and Qms (from the width of the peak).
  5. 5Results are saved to Reports; Export Results shares a text report.

Tips

  • The app cannot measure the voltage across and current through a driver, which a true impedance measurement needs.
  • Use the figures to compare drivers measured the same way, and a dedicated impedance jig for enclosure design.
Phase & Polarity Tester

Checks whether a speaker is wired with the correct polarity.

How to use it

  1. 1Make sure only the speaker under test plays; the click goes to the phone's current audio output.
  2. 2Hold the phone a short distance in front of it in a quiet room and tap Start Test.
  3. 3The app plays a short positive-going click and records it.
  4. 4Normal (In-Phase) means the strongest recorded peak was positive; Inverted (Out-of-Phase) means it was negative.
  5. 5Also shown: phase difference, channel correlation, group delay (5 ms gate, 200 Hz–20 kHz) and coherence with a rating.

Tips

  • A phone's own microphone path can invert polarity, so test a speaker you know is wired correctly first and use it as your reference.
  • If it reads inverted, check the + and − connections.
Real-Time Analyzer (RTA)

Sound in IEC 61260 fractional-octave bands from 20 Hz to 20 kHz.

How to use it

  1. 1Press START.
  2. 2Resolution chips: 1/1, 1/3 (default), 1/6 or 1/12 octave, giving 10, 31, 60 or 120 bands.
  3. 3Time weighting: Fast (125 ms, default), Slow (1 s) or Impulse (35 ms rise, 1.5 s decay).
  4. 4Each bar is a band level in dBFS (a full-scale sine reads 0 dB), with a peak marker that falls at 3 dB per second.
  5. 5Overall Level is the power sum of all bands. Reset Peak clears the markers.

Tips

  • Each band sums the power inside it, so pink noise reads flat.
  • The RTA runs at 48 kHz with an 8,192-point FFT, so the narrowest 1/12-octave bands in the lowest octaves can stay empty.
  • Use Slow to steady the bars for noise signals.
Waterfall / CSD

A live 3D waterfall of the microphone spectrum: the newest slice is at the front and older slices recede.

How to use it

  1. 1Press START, then excite the room or speaker, for example with a short burst of noise or a single bass note.
  2. 2Time Slices sets 20 to 100 slices of history (default 50); Clear empties the display.
  3. 3The display spans 20 Hz to 20 kHz on a log axis and 0 to −80 dB; Peak shows the strongest frequency.

Tips

  • Ridges that persist after the sound stops are frequencies that ring on, such as room modes or cabinet resonances.
  • This is a real-time waterfall, not a cumulative spectral decay computed from a measured impulse response.
Impulse Response

Captures a room's response to one sharp sound and derives acoustic parameters.

How to use it

  1. 1Tap Capture IR. The status reads Waiting for impulse….
  2. 2Make a sharp sound; a balloon pop is best. Capture starts when the input passes about −20 dBFS and records 3 seconds at 48 kHz.
  3. 3The top chart shows the impulse response (time 0 at the peak); the second shows the Schroeder energy decay curve, 0 to −60 dB.
  4. 4Read RT60, EDT, C50, C80 and Ts (center time). Pinch to zoom either chart.
  5. 5Export IR shares a text summary that also includes D50, the sample rate and sample count.

Tips

  • RT60 shows — when the decay is too short to measure.
  • Impulse Response results are not saved to Reports, so export the ones you want to keep.
THD Measurement

Total harmonic distortion of a pure tone, with THD+N, SINAD and ENOB.

How to use it

  1. 1Play a clean sine tone (1 kHz is the standard; 440 Hz also works) through the system under test, from a second device, so the phone's microphone or line input receives it.
  2. 2Press START and choose Auto-detect, 1 kHz or 440 Hz.
  3. 3THD combines harmonics 2 to 11 relative to the fundamental, in % and dB: green below 0.1%, cyan below 1%, orange below 5%, red above.
  4. 4THD+N counts everything except the fundamental (up to 22 kHz, unweighted). SINAD is its inverse in dB, and ENOB = (SINAD − 1.76) ÷ 6.02.
  5. 5The Harmonic Distribution bars show H2 to H11.

Tips

  • The analysis uses a 16,384-point FFT with a 7-term Blackman-Harris window and sums each tone over its full main lobe.
  • The result always includes the phone's own microphone and input stage.
  • NO SIGNAL means no usable tone was found: play it louder or closer, or pick 1 kHz or 440 Hz.
SNR Measurement

How far a test tone stands above the noise, plus level statistics.

How to use it

  1. 1Play a steady test tone into the microphone or input and press START.
  2. 2Choose Auto, 1 kHz or 440 Hz for the Signal Frequency.
  3. 3Signal-to-Noise Ratio compares the tone with the noise; the tone's harmonics are left out of the noise. Green at 90 dB or more, cyan 70–89, orange 50–69, red below 50.
  4. 4Signal and Noise Floor are in dBFS. Also shown: dynamic range, RMS and peak, crest factor and headroom.
  5. 5The Noise Spectrum chart shows where the noise lives; pinch to zoom.

Tips

  • Spikes at 50 or 60 Hz and their multiples are mains hum.
  • Aim for a strong signal well below clipping, roughly −12 to −6 dBFS peak.
Output Testing13 topics
Frequency Generator

A steady test tone from 20 Hz to 20 kHz, noise, or a repeating sweep.

How to use it

  1. 1Turn the Frequency knob (logarithmic, default 440 Hz) or tap a preset: 100, 440, 1K or 10K. The frequency changes live while playing.
  2. 2Choose a waveform with the LEDs: Sine, Square, Triangle or Saw. White Noise and Pink Noise keys play noise instead.
  3. 3Set the Output Level knob, 0–100% of digital full scale (default 50%). The phone's media volume also applies.
  4. 4Sweep keys: 20–20K Hz, 100–10K Hz or Custom (one decade up from the knob). Each is a logarithmic 10-second sweep that repeats until you press STOP.
  5. 5Press PLAY; it turns into STOP.

Tips

  • Start at a low volume and raise it gradually.
  • Generators stop when you leave their screen. For THD and SNR, play the tone from a second device.
Noise Generator

Broadband noise for listening tests, masking and room checks.

How to use it

  1. 1Choose White, Pink, Brown, Blue or Violet; a card explains the selected type.
  2. 2Set the Volume slider (default 70%) and the Fade In and Fade Out times (default 500 ms).
  3. 3Tap Play Noise. Changing the type while playing switches immediately.

Tips

  • Pink noise has equal energy per octave and is the usual choice for speakers and rooms.
Frequency Response

Sweeps a tone through the phone's output and plots what the microphone hears.

How to use it

  1. 1Choose the Sweep Type: Log (default), Linear or Stepped.
  2. 2Set Start and End Freq (default 20 and 20,000 Hz) and Duration (1 to 30 s, default 5).
  3. 3Tap Measure. While the sweep plays, the app follows the strongest frequency and its level.
  4. 4The smoothed curve is plotted on a log axis, normalised to 0 dB at 1 kHz. Pinch to zoom; Clear empties the chart.

Tips

  • The curve includes the speaker, the room and the phone's microphone, so compare measurements made with the same setup and phone position.
  • Frequency Response results are not saved to Reports.
Speaker Test

Quick listening tests for speakers and headphones. Nothing is recorded.

How to use it

  1. 1Channel Identification: L, L+R or R plays a 440 Hz tone for 2 seconds.
  2. 2Frequency tests: Bass 50 Hz, Low-Mid 250 Hz, Mid 1 kHz and Treble 8 kHz, each for 3 seconds.
  3. 3Full Range Sweep: 20 Hz to 20 kHz over 10 seconds.
  4. 4Polarity Check: a 10 ms + Positive or − Negative pulse.
  5. 5Set the Test Volume fader (default 50%). Tap a key again to stop.

Tips

  • A correctly wired woofer pushes outward on the positive pulse.
  • Start at a low volume to protect your speakers.
Microphone Test

Checks the microphone's level, noise and clipping.

How to use it

  1. 1Press START and stay quiet for a few seconds so the noise floor can be measured.
  2. 2Make sounds at different levels, such as speech and a clap.
  3. 3Input Level shows the current peak in dBFS (orange above −12, red above −3), and the LED meter spans −60 to 0 dBFS with a 2-second peak hold.
  4. 4Read Peak and RMS, the clipping count, Noise Floor, Dynamic Range, Sensitivity and the Quality Rating.
  5. 5Reset clears the results; STOP shows a summary.

Tips

  • This test captures at 44,100 Hz in 32-bit float.
Audio Latency Test

Round-trip latency from the audio output back to the input.

How to use it

  1. 1Connect a loopback cable from output to input for the most accurate result, or hold the phone close to a speaker in a quiet room.
  2. 2Set Number of Tests (3 to 50, default 10) and the Detection Threshold (0.01 to 1.00 of full scale, default 0.10).
  3. 3Tap Start Test. Each test plays a 10 ms, 1 kHz pulse and times its arrival, up to 500 ms.
  4. 4Read the latest Round-Trip Latency, Min, Average, Max and Jitter.

Tips

  • Rating: Professional up to 10 ms, Excellent up to 20, Good up to 40, Acceptable up to 80, Fair up to 150, otherwise High Latency.
  • No detection? Lower the threshold or raise the volume. Early triggers? Raise the threshold and quiet the room.
Bluetooth Latency

Identifies the connected Bluetooth audio device and measures its delay.

How to use it

  1. 1Connect your Bluetooth headphones or speaker, open the tool and tap Measure Latency.
  2. 2Allow microphone access and, on Android 12 and later, Nearby devices.
  3. 3Hold an ear cup or the speaker close to the phone's microphone while 5 test tones play.
  4. 4Read the device name, codec (SBC, AAC, aptX, aptX HD, LDAC, LC3 or Opus), sample rate, estimated latency, measured latency and confidence.

Tips

  • Codec detection needs Android 13 or later and a phone that reports it. Otherwise Codec shows Unknown and the estimate assumes SBC, about 150 ms.
  • Connect only one Bluetooth audio device at a time.
BT Alignment Wizard

A guided, five-step process for time-aligning a Bluetooth output with a wired source.

How to use it

  1. 1Connect & Detect: read the device name, codec and estimated latency.
  2. 2Measure Latency: eight test tones are timed with the phone's microphone, giving average latency, jitter, min, max and confidence.
  3. 3Delay Compensation: the delay to add to your wired source in milliseconds and in samples at 48 kHz, with a table of how jitter affects phase from 50 Hz to 10 kHz.
  4. 4Phase Verification (optional): record 2 seconds and analyze coherence, polarity, time offset and group-delay difference.
  5. 5Final Report: a score out of 100, a grade from A to F, a verdict and recommendations. Save to Library, or share as text or PDF.

Tips

  • Step 4 records with the phone's own microphones. With a mono microphone both channels carry the same signal, so coherence reads high.
  • If no tone is detected, the wizard continues with the codec estimate, marked est.
USB Audio Testing

Tests USB DACs, headsets and audio interfaces.

How to use it

  1. 1Connect the device through USB-C or an OTG adapter. The screen updates when a device is plugged in or removed.
  2. 2Test Output plays a tone; Test Input reports the input level in dB.
  3. 3Measure Latency plays a pulse and finds it in the recording; connect the interface's output to its input first.
  4. 4Device information shows the name and the sample rates and channel counts the device reports.

Tips

  • Latency rating: Excellent below 10 ms, Very Good below 20 ms, Good below 50 ms.
  • Android does not expose vendor and product IDs here, so they read Not available.
Multi-Channel Test

Identifies the channels of a stereo or surround system.

How to use it

  1. 1Choose Stereo (2.0), 2.1, 5.1 or 7.1.
  2. 2Tap a speaker (FL, FR, C, LFE, SL, SR, RL or RR) to play a 1.5-second tone on that channel: 440 Hz, or 60 Hz for LFE.
  3. 3Or tap Test All Channels to step through every channel, with each speaker highlighted in turn.

Tips

  • You need an output that carries that many channels, such as HDMI or USB audio. On a stereo output, Android may mix the channels down.
Channel Balance

Compares the left and right levels of headphones or speakers.

How to use it

  1. 1Set the Test Frequency: 100 Hz to 10 kHz in 100 Hz steps (default 1 kHz).
  2. 2Left, Center and Right play the tone continuously; tap again to stop.
  3. 3Tap Measure Balance. The app plays half a second on the left, then the right, and records each.
  4. 4Read the left and right levels, the level difference and the twin LED meters (20 dB span).

Tips

  • Within 1 dB the result reads Channels are balanced; otherwise it states which side is louder and by how much.
  • Keep the phone the same distance from both sides.
Speaker Alignment Suite

Delay, response and phase checks for multi-speaker systems, measured from the listening position.

How to use it

  1. 1Delay Alignment: tick at least two speakers (front, center, surrounds, subwoofer or a custom label). Each is measured five times with a chirp, 200 Hz–8 kHz, or 30–200 Hz for the subwoofer.
  2. 2The results table lists each speaker's delay (ms), distance (cm) and DSP Offset; the farthest speaker is the reference.
  3. 3Response Matching: choose Speaker A and B and a 2, 3, 5 or 8-second sweep. You get a match score, max and average deviation, and the ranges that differ by more than 3 dB.
  4. 4Phase Check: choose two speakers and a Full Sweep or Custom Frequencies (such as 60, 80, 100, 120 for a sub crossover). You get in or out of phase, coherence, polarity, time offset and a per-band grade.
  5. 5Every mode offers Save to Library, Share Text and Share PDF.

Tips

  • The phone sends the same test signal to its output for every speaker; it cannot address the individual speakers of a receiver or DSP. Set up your system so only the speaker being measured plays.
  • Keep the phone still between measurements.
Audio Device Info

What audio hardware Android reports.

How to use it

  1. 1Output and Input Devices: each device's name, type, sample rates, channel configurations and encodings.
  2. 2System Audio Settings: music and ring volume, ringer mode, speakerphone, Bluetooth SCO and wired headset state.
  3. 3Audio Capabilities: LED lamps for Low Latency, Pro Audio, MIDI and USB Audio, lit when the phone supports them.
  4. 4Refresh re-reads everything after you connect or remove a device.

Tips

  • With TalkBack, each capability lamp is announced as Supported or Not supported.
Calibration2 topics
SPL Reference Calibration

The one calibration that changes a reading: it sets the Decibel Meter's offset between the microphone's digital level and dB SPL.

How to use it

  1. 1Go to a quiet room and close other audio apps.
  2. 2Switch on a sound level calibrator that plays 1 kHz at a known level, usually 94 or 114 dB SPL. Hold it snugly over the phone's main microphone, or fit it to your external measurement microphone.
  3. 3Open Calibration Manager and tap Calibrate on SPL Reference Calibration.
  4. 4Enter the calibrator's level (40 to 140 dB) and tap Calibrate. The app waits half a second, records 1 second and checks that the tone is within 5% of 1 kHz.
  5. 5On success the card shows Calibrated with the reference level, and the Decibel Meter's CAL lamp lights with the unit dB SPL.

Tips

  • No calibrator? Measure a steady 1 kHz tone at the phone's position with a trusted sound level meter and enter that reading. It is less precise.
  • Recalibrate after changing phones or external microphones, after system updates, and before critical measurements.
Microphone, Voltage and Line Level calibrations

Reference records shown on the Calibration screen. They do not change any reading.

How to use it

  1. 1Microphone Calibration records 1 second and marks the card Calibrated with today's date.
  2. 2Voltage Reference Calibration stores the RMS voltage you enter with a 1-second capture.
  3. 3Line Level Calibration stores the professional +4 dBu (1.228 V) reference with a 1-second capture.
  4. 4Reset to Default clears all four calibrations after you confirm.

Tips

  • Only the Decibel Meter uses a calibration; nothing corrects frequency response from one.
Reports & Export1 topic
Saving and exporting results

Saved measurements stay on your phone, newest first, and leave only through the Android share sheet.

How to use it

  1. 1Room Acoustics, Impedance Analyzer and Phase & Polarity Tester save automatically after each measurement.
  2. 2BT Alignment Wizard and Speaker Alignment Suite save when you tap Save to Library.
  3. 3In Reports & Export, Share offers Export as CSV, Export as PDF or Share Report (plain text); Delete removes an entry after you confirm.
  4. 4Export all in the toolbar exports every saved measurement as CSV, PDF or both.
  5. 5CSV files are UTF-8 with quoted text and timestamps as yyyy-MM-dd HH:mm:ss. PDFs are A4: one measurement per page, or a title page and two measurements per page.

Tips

  • No storage permission is needed: files are written to the app's cache and handed to the share sheet.
  • Uninstalling the app deletes saved measurements, so export the ones that matter.
Measurement Concepts2 topics
Key terms

What the numbers on the panels mean.

How to use it

  1. 1dBFS is a digital level: 0 dBFS is the loudest signal the input can record, so real readings are negative. dB SPL is acoustic pressure and needs a calibration to be absolute.
  2. 2A, C and Z weighting (IEC 61672-1): A follows the ear at moderate levels, C is nearly flat, Z is unweighted. All three read the same at 1 kHz.
  3. 3Leq is the steady level with the same total energy as a varying sound over the measurement time.
  4. 4FFT resolution is the sample rate divided by the FFT size: 4,096 points at 44.1 kHz give about 10.8 Hz.
  5. 5RT60 is the time sound takes to decay by 60 dB, often extrapolated from T30 or T20. EDT uses the first 10 dB.
  6. 6C50 and C80 compare the energy in the first 50 or 80 ms with what follows; D50 is the share in the first 50 ms; Ts is the energy-weighted arrival time.
  7. 7THD compares added harmonics with the tone, THD+N also counts noise, SINAD is signal over noise plus distortion, and ENOB expresses SINAD as bits.
  8. 8Typical Bluetooth codec latencies used by the app: SBC 150 ms, AAC 120, aptX 70, aptX HD 130, LDAC 100, Opus 80 and LC3 (LE Audio) 30. Real devices vary.

Tips

  • +6 dB doubles sound pressure and +3 dB doubles power; 1 to 3 dB is about the smallest change most people notice.
Troubleshooting

Fixes for the most common problems.

How to use it

  1. 1No audio input: check the microphone permission, close apps that use the microphone, and clean the microphone opening.
  2. 2Readings jump around: reduce background noise, keep the phone still and wait 2 to 3 seconds for readings to settle.
  3. 3SPL meter says uncalibrated: run SPL Reference Calibration with a 1 kHz calibrator over the main microphone.
  4. 4THD or SNR shows NO SIGNAL: play the tone louder or closer, or choose 1 kHz or 440 Hz instead of Auto-detect.
  5. 5No sound from generators: raise the media volume, check the active output and disable sound effects or equalizers.
  6. 6Bluetooth: connect the device as media audio and allow Nearby devices on Android 12 and later.

Tips

  • Clearing the app's storage or reinstalling deletes saved measurements and calibrations.
  • Still stuck? Email support@strategia-x.com with your phone model and Android version.
Support

Frequently asked questions

Straight answers about accuracy, calibration, privacy and the tools.

Is DL Audiophile free?

Yes. All 27 tools are free on Google Play with no in-app purchases. The app shows Google AdMob ads: a banner on some screens and, occasionally, a full-screen ad when you leave the Oscilloscope, Decibel Meter or THD Measurement after a measurement, at most three per session and at least two minutes apart.

What do I need to run it?

Android 7.0 (API 24) or later and a working microphone for the measurement tools; the generators and listening tests work without one. Every measurement works offline. The internet is used only for ads and Google's consent form.

How accurate is it compared with professional equipment?

The analysis follows published standards (IEC 61672-1 weighting, IEC 61260 octave bands, ISO 3382 room acoustics), but the result always includes your phone's microphone. Phone microphones are tuned for voice and lose accuracy in the deep bass and at very high levels. Use the app for comparisons and trends, run an SPL Reference Calibration for absolute SPL, and use a USB measurement microphone for the best results. It is a measurement aid, not a certified instrument.

Does the app record or upload my audio?

No. Audio is processed on the phone in real time and is never uploaded or saved as a recording. Saved measurements are numbers and text in the app's private storage, and they leave the phone only when you export them through the share sheet.

What's new in version 1.4.0?

A hardware-style interface on every screen (machined panels, LEDs, seven-segment readouts, faders and knobs, in black anodised or brushed silver), IEC 61672-1 A/C/Z filters on the SPL meter, stored SPL calibration now applied with a CAL lamp, absolute dBFS levels in the Spectrum Analyzer, harmonics excluded from SNR noise, RT60 fallback to T30 and T20, a five-page introduction, fewer permissions and a rewritten user guide for all 27 tools.

How do I calibrate the decibel meter?

Hold a 1 kHz acoustic calibrator (usually 94 or 114 dB SPL) over the phone's main microphone, open Calibration Manager, tap Calibrate on SPL Reference Calibration and enter the calibrator's level. The app records 1 second and checks the tone is within 5% of 1 kHz. Once calibrated, the Decibel Meter's CAL lamp lights and the unit reads dB SPL. Without a calibration it uses a typical 94 dB offset and reads dB SPL (uncalibrated).

Do the Microphone, Voltage and Line Level calibrations change my readings?

No. They are reference records shown on the Calibration screen. Only the SPL Reference Calibration changes a reading, and only on the Decibel Meter.

Which FFT size should I use?

The Spectrum Analyzer runs at 44.1 kHz, so the spacing between frequency points is 44,100 ÷ FFT size: about 86 Hz at 512, 10.8 Hz at 4,096 (the default) and 2.7 Hz at 16,384. Larger sizes separate close tones but update less often; smaller ones react faster.

How do I measure room acoustics?

Open Room Acoustics at the listening position in a quiet room, tap Start Measurement and, when CLAP NOW! appears, clap once or pop a balloon. The app records 3 seconds and reports RT60, EDT, C50, C80 and a room rating. RT60 uses the full decay when the recording allows, otherwise T30 or T20 as ISO 3382 describes.

Is the Waterfall / CSD a true cumulative spectral decay?

No. It is a live 3D waterfall of the microphone spectrum, which shows which frequencies keep ringing after a sound stops. A true CSD is computed from a measured impulse response; for decay parameters use the Impulse Response or Room Acoustics tools.

Can I use it for speaker building?

Yes, with care. The Phase & Polarity Tester checks wiring, Frequency Response and the Waterfall show response and ringing, and Speaker Test plays tones, sweeps and polarity pulses. The Impedance Analyzer gives an acoustic estimate of the impedance curve and Thiele-Small figures for comparing drivers; it cannot measure voltage and current at the terminals, so use an impedance jig for enclosure design.

What does the Speaker Alignment Suite do?

Three modes measured from your listening position: Delay Alignment (chirp time-of-arrival, distance and a DSP offset per speaker), Response Matching (two speakers compared with a 0–100% match score) and Phase Check (coherence, polarity and per-band grades). The phone sends each test signal to its output, so it cannot address individual speakers of a receiver or DSP: set up your system so only the speaker being measured plays.

How does Bluetooth latency testing work?

Bluetooth Latency reads the connected device's name, codec and sample rate, then times 5 test tones through it with the phone's microphone and reports the measured latency with a confidence figure. Codec detection needs Android 13 or later; otherwise the codec shows Unknown and the estimate assumes SBC (about 150 ms). The BT Alignment Wizard adds delay compensation, optional phase verification and a graded report.

Which export formats are available?

CSV, PDF and plain text, through the Android share sheet, so you choose the destination. Room Acoustics, Impedance and Phase & Polarity results save automatically; the alignment tools save when you tap Save to Library. You can export one measurement or all of them, and no storage permission is needed.

Can I change how the app looks?

Yes. Settings → Dark Finish switches between black anodised panels (the default) and brushed silver. Haptic feedback for button presses and knob detents can be turned off in Settings too.

Is it accessible with TalkBack?

Yes. The hardware-style controls are built on standard Android controls. Meters, knobs and capability lamps have spoken labels, knobs behave as sliders, text follows the system font size, and color-coded results always show a number or text rating as well.

What permissions does it ask for?

Microphone for measurements; Nearby devices (Android 12+) or Bluetooth (Android 11 and lower) only to read a connected headset's name and codec, never to scan or pair; internet and network state for ads and consent; and vibration for haptics. No storage, location, contacts or camera permissions.

Still have a question? Include your phone model and Android version.

support@strategia-x.com

Put a measurement bench in your pocket.

27 tools, two finishes, zero recordings. DL Audiophile 1.4.0 is free on Google Play.